It is not news that the transition period of dairy cows is challenging. As cows go through intense changes in nutrient energy balance, and other metabolic processes, it is important to carefully manage them to avoid subsequent problems such as high incidences of postpartum diseases, reduced milk production, subfertility, and culling. One of the main topics of discussion within transition period management is the body condition score (BCS) of periparturient cows. Indeed, the BCS of cows at dry-off and parturition, and BCS changes within these periods have been associated with differences in cow health, performance, and survival.
One study conducted in the mid-80s highlighted the detrimental impacts associated with inadequate BCS at dry-off until 150 days in milk (DIM; Gearhart et al., 1990). In that study, overconditioned cows (BCS ≥ 4.0 using a five-point scale and 0.25 increments) at dry-off were more likely to develop cystic ovarian disease and reproductive problems. Underconditioned (BCS ≤ 2.0) or overconditioned cows at drying off were more prone to foot problems after calving. Lastly, cows that developed dystocia or were culled lost more condition during the dry period than those that did not develop dystocia or were not culled. In subsequent years, more studies depicted a similar picture between BCS or BCS changes and postpartum diseases, milk production, reproduction, and culling in dairy cows. For instance, cows that calved with a BCS ≤ 2.75, had greater odds of developing endometritis compared with cows that calved with a BCS between 3.0 and 3.5 (Odds Ratio = 0.53), and ≥ 3.75 (Odds Ratio = 0.62; Dubuc et al., 2010).
Moreover, a relationship between occurrence of postpartum disease and prepartum changes in BCS (ΔBCS) was also described. Cows with excessive prepartum loss of BCS (ΔBCS ≤−0.75) had greater odds of developing postpartum uterine diseases compared with cows in which BCS did not change (Odds ratio = 1.68; Chebel et al., 2018). The same study also reported that cows with moderate loss of BCS (ΔBCS = −0.5 to −0.25) had greater odds of developing indigestion compared with cows that gained BCS (ΔBCS ≥0.25; Odds ratio = 1.58). Different odds of receiving support therapy, parenteral anti-inflammatories, and antimicrobials within 60 DIM were also observed among different levels of BCS loss (Chebel et al., 2018), highlighting that postpartum cow health is intimately associated with ΔBCS in the prepartum period. As previously mentioned, changes in BCS in the periparturient period were also associated with differences in cow performance and culling in dairy cows. For instance, different times to pregnancy were associated with intensity of ΔBCS in the prepartum period (Chebel et al., 2018; Figure 1). Furthermore, differences in reproductive performance and culling were associated with ΔBCS in the postpartum period (Figure 2; Manriquez et al., 2021; Krogstad et al., 2024). Differences in pre- and postpartum BCS and ΔBCS were also associated with milk yield (Figures 3-5; Manriquez et al., 2021; Krogstad et al., 2024).
Although the mechanisms and underlying biological processes that explain the relationship between BCS and ΔBCS in the periparturient period and cow performance and health are still not completely elucidated, studies have shed light on potential mechanisms. A study from 2002 highlighted that prepartum dry-matter intake (DMI) linearly decreased with BCS increase (Hayirli et al., 2002). In fact, prepartum BCS explained almost 10% in prepartum DMI variations, and while no major variations in DMI were observed between underconditioned (mean BCS = 2.8) and moderately conditioned multiparous cows (mean BCS = 3.6), overconditioned cows (mean BCS = 4.4) had reduced DMI as a proportion of body weight compared to the 2 previous groups. Similar results were described by other research groups (Figure 6; Chebel et al., 2018; Daros et al., 2021; Casaro et al., 2024). In 2024, one study that assessed the association between prepartum BCS, DMI, and energy balance, reported that overconditioned cows had a greater and persistent reduction of DMI compared with underconditioned and moderately conditioned cows (Figure 7; Casaro et al., 2024). Additionally, a quadratic effect was observed for prepartum BCS on daily and cumulative milk yield, suggesting that there is an optimal prepartum BCS to optimize milk production in postpartum dairy cows.
Considering the relationship between BCS and DMI, it is possible that because overconditioned cows have lowered DMI compared to others, the amount of available nutrients is reduced. Other studies have depicted the association of DMI and nutrient availability on other functions such as immunological response. For instance, Galvão et al. (2010) reported that cows that developed postpartum uterine diseases had a greater degree of negative energy balance as depicted by reduced blood glucose concentrations and increased NEFA and BHBA concentrations (compared with healthy cows). In addition, cows that developed metritis had lower intracellular immune cell glycogen levels, which could be a major predisposing factor for disease because of decreased availability of oxidative fuels. Altogether, good BCS management of periparturient cows is critical for a successful transition period and its intrinsic factors, such as cow performance, health, and culling. Studies have shown that BCS at dry-off partially explains the ΔBCS in the periparturient period and should therefore be one of the main factors to focus on for transition period management protocols. Additionally, the intensity of ΔBCS was associated with cow performance and should be taken into consideration and monitored consistently.
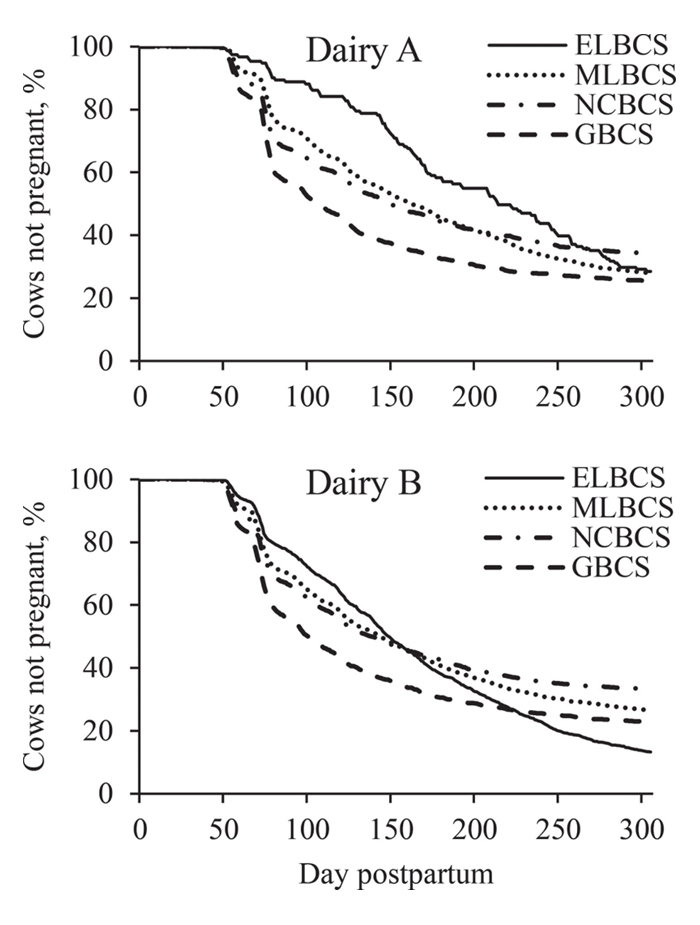
Figure 1. Survival analysis of the interval from parturition to pregnancy according to BCS change during the dry period (ΔBCS) and dairy. Association between ΔBCS and the interval from parturition to pregnancy according to the test of equality Wilcoxon: mean (±SEM) days to pregnancy for cows from dairy A (P < 0.001): Excessive loss of BCS (ELBCS; ΔBCS ≤−0.75) = 199.9 ± 6.9 d, Moderate loss of BCS (MLBCS; ΔBCS = −0.5 to −0.25) = 161.2 ± 2.2 d, No change in BCS (NCBCS; ΔBCS = 0) = 153.5 ± 2.3 d, and Gained BCS (GBCS; ΔBCS ≥0.25) = 133.2 ± 2.3 d; mean (±SEM) days to pregnancy for cows from dairy B (P < 0.001): ELBCS = 160.4 ± 2.1 d, MLBCS = 157.2 ± 1.4 d, NCBCS = 159.2 ± 1.9 d, and GBCS = 136.3 ± 2.3 d. Adapted from Chebel et al., 2018.
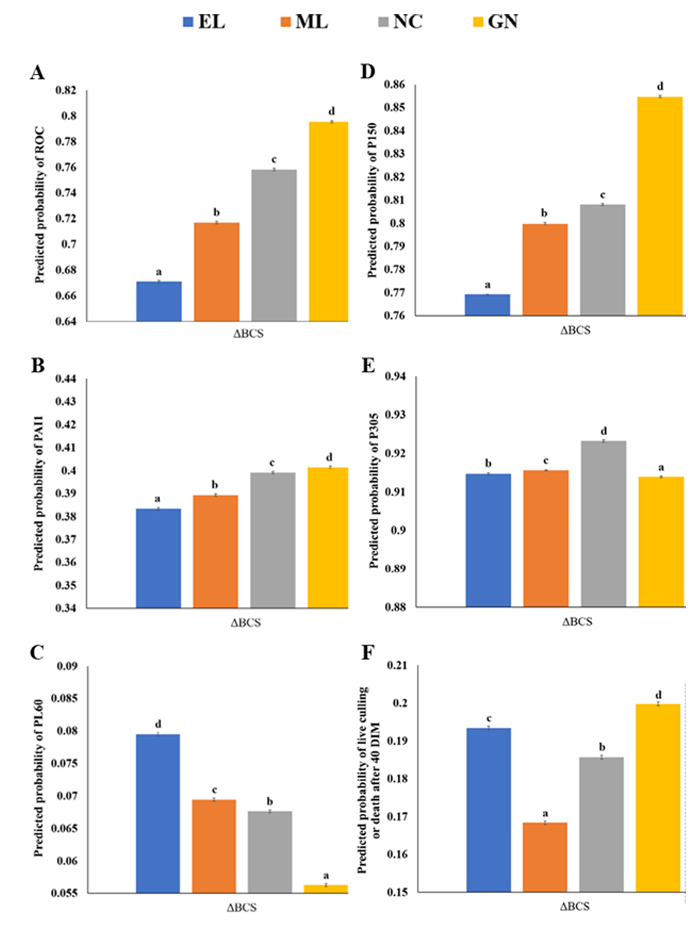
Figure 2. (A) Predicted probabilities (LSM and 95% CI bars) for resumption of ovarian cyclicity (ROC), (B) pregnancy at first AI (PAI1), (C) pregnancy loss (PL60), pregnancy (D) at 150 DIM (P150) and (E) at 305 DIM (P305), and (F) live culling or death after 40 DIM presented by BCS change category; EL = excessive loss of BCS (ΔBCS ≤−0.75); ML = moderate loss of BCS (ΔBCS = −0.5 to −0.25); NC = no change of BCS (ΔBCS = 0); GN = gained BCS (ΔBCS ≥0.25). Adapted from Manriquez et al., 2021.
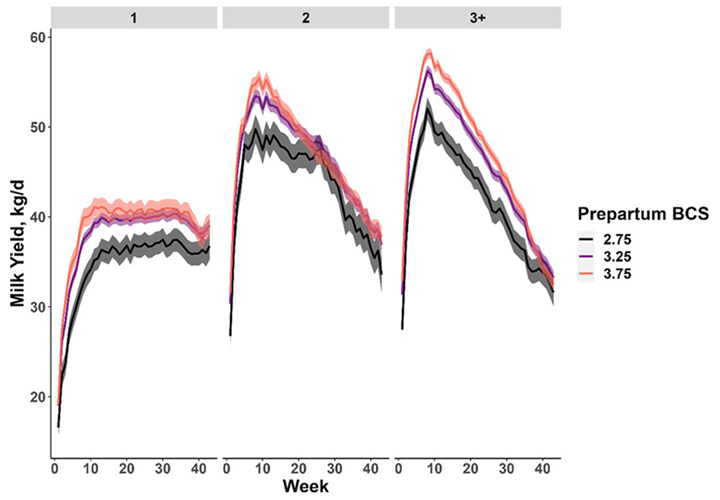
Figure 3. Prepartum BCS (BCS; observed within 14 d of projected calving) was quadratically associated with milk yield (P < 0.01). The three-way interaction of prepartum BCS, parity, and week was associated with milk yield through 300 d in milk (P = 0.03). The plot displays milk yield estimates (±SEM) for 1st, 2nd, and 3rd+ parity cows with BCS of 2.75, 3.25 or 3.75. n = 826 cows. Adapted from Krogstad et al., 2024.
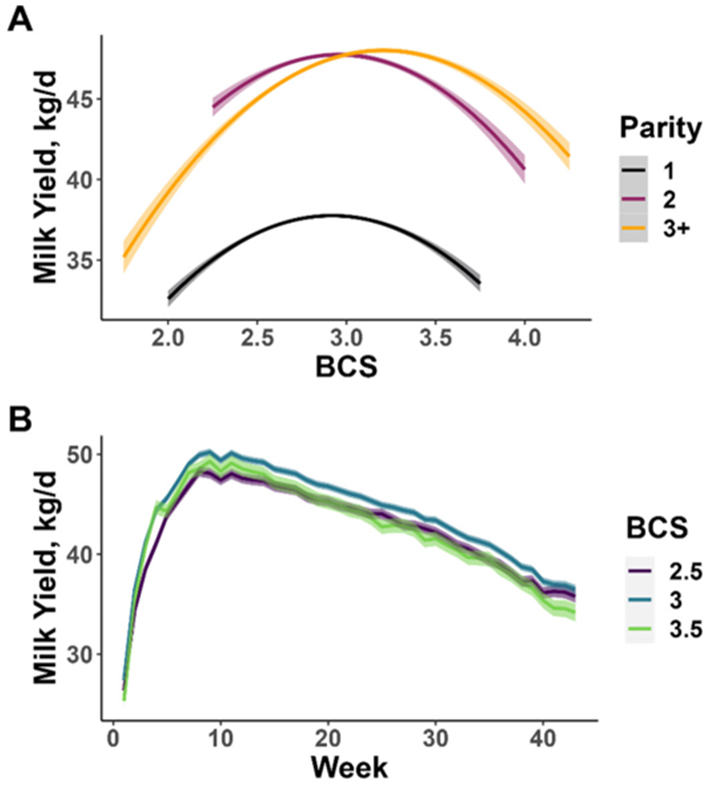
Figure 4. Associations of postpartum body condition score (BCS; observed between 14 and 21 DIM) with milk yield. A) Postpartum BCS was quadratically associated with milk yield (P < 0.01) and interacted with parity (P = 0.05) to be associated with milk yield. B) Postpartum BCS interacted with week (P < 0.01) to be associated with milk yield. The plot shows milk yield estimates (±SEM) for each week of lactation for cows with BCS of 2.5, 3, or 3.5. Adapted from Krogstad et al., 2024.
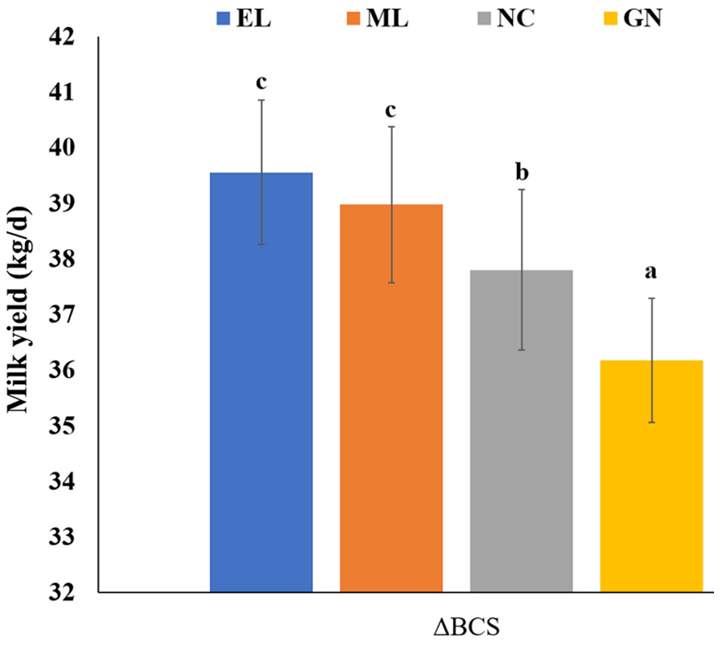
Figure 5. Average daily milk yield (LSM and 95% CI bars) in the first 90 DIM (kg/d) presented by body condition score change category; EL = excessive loss of BCS (ΔBCS ≤−0.75); ML = moderate loss of BCS (ΔBCS = −0.5 to −0.25); NC = no change of BCS (ΔBCS = 0); GN = gained BCS (ΔBCS ≥0.25). Adapted from Manriquez et al., 2021.
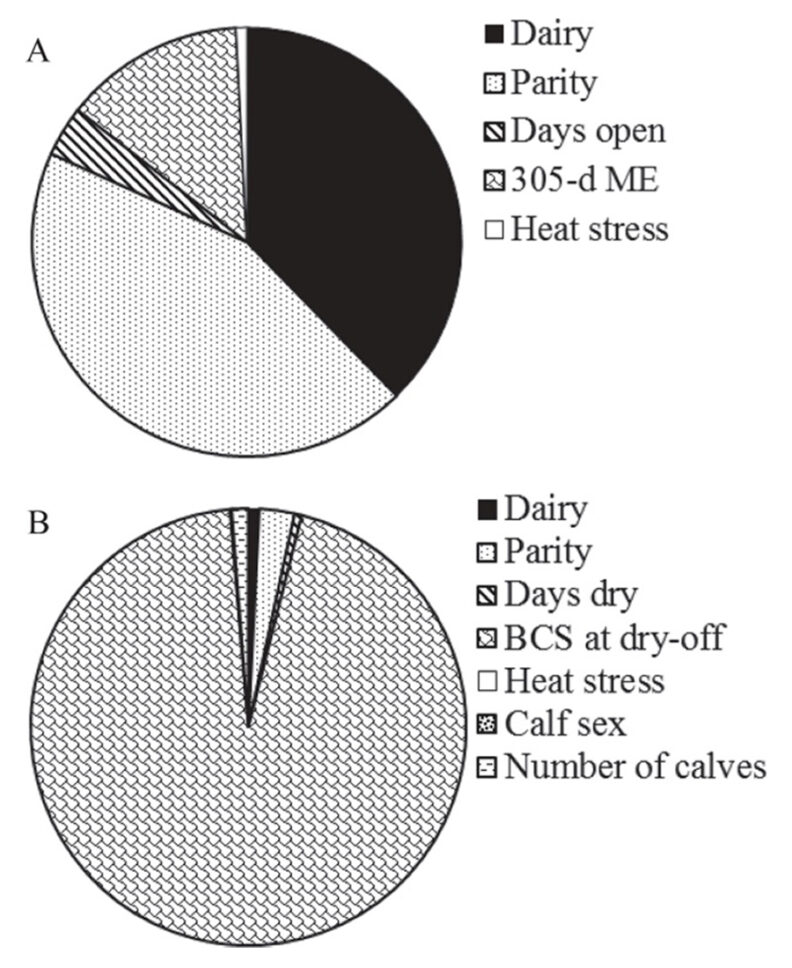
Figure 6. Proportion of variation (%) in BCS at dry off (A) and BCS change during the dry period (B) explained by independent variables retained in the multivariate model. Coefficient of determination of multivariate model for BCS at dry off = 6.9% (dairy = 38%, parity = 44%, days open = 4%, 305-d ME = 14%, heat stress = 1%); R2 of multivariate model for BCS change during the dry period = 57.4% (dairy = 0.8%, parity = 2.6%, length of the dry period = 0.5%, BCS at dry off = 94.7%, percentage of days with temperature-humidity index ≥72 = 0.04%, calf sex = 0.09%, number of calves born = 1.2%). 305-d ME = 305-d milk yield mature equivalent. Adapted from Chebel et al., 2018.
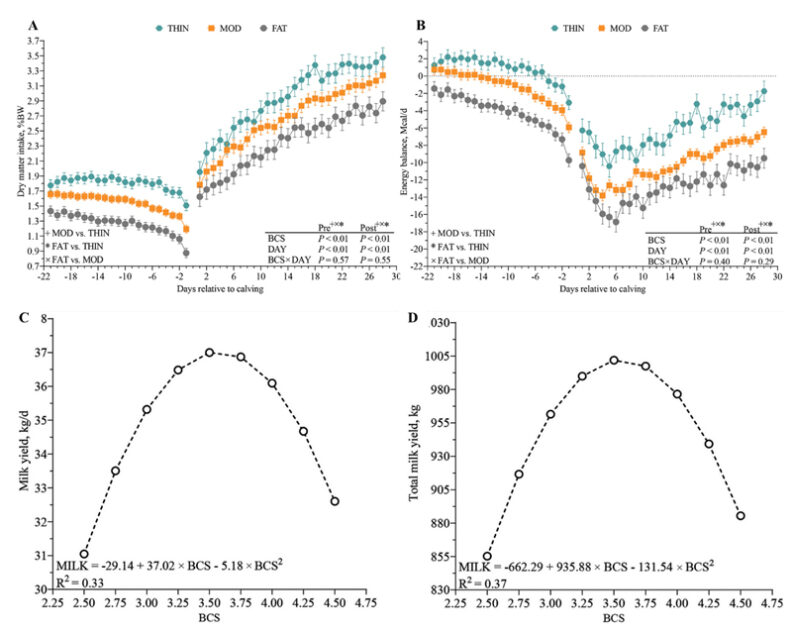
Figure 7. (A) Pre- and postpartum DMI%BW according to BCS in multiparous cows. Cows were categorized according to their BCS at 21 d before calving as fat (circles; BCS ≥ 4.00; n = 83), moderate (MOD; squares; BCS 3.25–3.75; n = 287), or thin (hexagons; BCS ≤ 3.00; n = 57). (B) Pre- and postpartum EB (Mcal/d) according to BCS in multiparous cows. Cows were categorized according to their BCS at 21 d before calving as fat (circles; BCS ≥ 4.00; n = 83), MOD (squares; BCS 3.25–3.75; n = 287), or thin (hexagons; BCS ≤ 3.00; n = 57). Daily milk yield (C) and cumulative milk in the 28-d postpartum (D) according to BCS 21 d before calving. Adapted from Casaro et al., 2024.