By Caio Figueiredo, Veterinary Medicine Extension
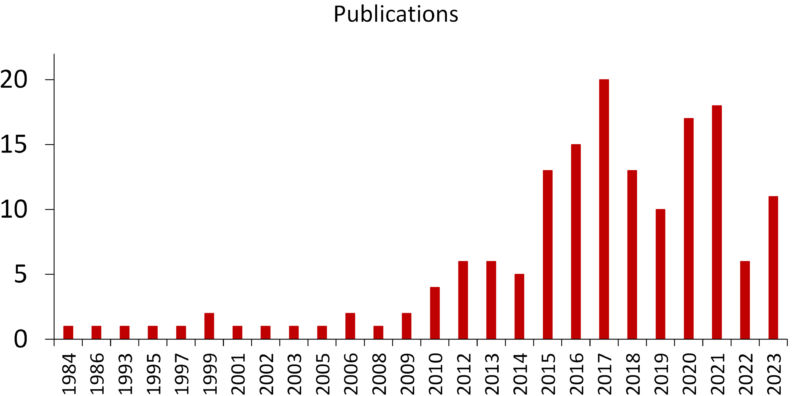
The use of automated activity monitors (AAM) in dairy operations has become more frequent as the dairy industry moves toward automation/robotization. Part of the observed successful implementation of AAM is attributed to the increased research effort that has focused on assessing the efficacy of the various advantages associated with the technology (i.e., collars and ear tags; Figure 1). In fact, 45% of projects presented at the 2023 American Dairy Science Association Annual Conference (Section Reproduction 1 only) employed the use of AAM. Among the several applications of AAM, recent studies have focused on evaluating their use for the prediction/diagnosis of diseases, as well as for the reduction of hormone use by implementing selective reproductive protocols.
A series of studies from Cornell University aimed to evaluate the performance of AAM to identify diseases based on health alerts – Health Index Score (HIS). Those studies depicted the varying sensitivity of AAM (cows fitted with collars) for the detection of cows with metabolic and digestive diseases, mastitis, or metritis. For instance, high sensitivity of HIS to detect cows with displaced abomasum (≥ 95%), ketosis (≥ 89%), and indigestion (≥ 86%) was observed (Stangaferro et al., 2016a). In addition, AAM highlighted cows with low HIS, before the identification of clinical signs of displaced abomasum, ketosis, or indigestion by herd veterinarians or farm personnel (-2.5 to -1.7 days relative to observed clinical signs; Stangaferro et al., 2016a). Despite high sensitivity of AAM to detect cows with metabolic or digestive diseases, a lower sensitivity to detect cows with mastitis (≥ 55%; Stangaferro et al., 2016b) or metritis (≥ 53%; Stangaferro et al., 2016c) was observed for AAM. Nevertheless, changes in HIS in cows with mastitis or metritis were observed before the identification of clinical signs by herd veterinarians or farm personnel (-1.2 to -0.5 days relative to observed clinical signs).
A recent study from the University of Florida evaluated the efficacy of cow behavior (i.e., feeding time, rumination time, idle time, and active time) in predicting the occurrence of metritis and clinical cure failure of metritis in postpartum dairy cows (Merenda et al., 2021). In that study, cow behavior by itself did not yield high sensitivity (≥ 59%) for the detection of cows with metritis in multivariable models; however, increased sensitivity (≥ 67%) was observed when cow behavior was combined with routinely available farm data in multivariable models. Furthermore, cow behavior yielded high sensitivity (≥ 86%) to detect cows with clinical cure failure of metritis up to 1 day before metritis diagnosis. Altogether, AAM represent an opportunity for early diagnosis of diseases and a potential strategy to circumvent limitations in farm personnel availability.
As an example, AAM has been investigated as a means to reduce the use of exogenous hormones in reproductive management protocols by prioritizing AI based on estrus detection using AAM (Rial et al., 2022; Gonzalez et al., 2023). Specific reproductive outcomes from each of these studies are described in Table 1 and Table 2. Although more studies are necessary in order to fully develop a targeted reproductive program, both studies show promising evidence that reducing the use of exogenous hormones while maintaining similar reproductive performance in dairy cows is possible using AAM.
Table 1. Pregnancies per AI at 39 ± 3 d after first AI based on the assigned reproduction management program and detection of estrus between 21 and 49 DIM. Adapted from Rial et al. (2022).
| Group | |||||||||
|---|---|---|---|---|---|---|---|---|---|
| ALL-TAI | P-AIE | TP-AIE | P-value | ||||||
| E-VWP | NE-VWP | E-VWP | NE-VWP | E-VWP | NE-VWP | Trt | E-group | Trt x E-group | |
| All | 49.1 | 46.2 | 41.8 | 38.8 | 43.6 | 35.3 | 0.02 | 0.07 | 0.62 |
| AIE | 43.4 | 40.7 | 49.2 | 36.5 | 0.86 | 0.06 | 0.23 | ||
| TAI | 49.6 | 45.8 | 52.8 | 37.7 | 34.3 | 37.5 | 0.07 | 0.27 | 0.38 |
Table 2. Effects of treatment on outcomes referent to first postpartum insemination. Adapted from Gonzalez et al. (2023).
| Primiparous | Multiparous | P-value | |||||||||||||
|---|---|---|---|---|---|---|---|---|---|---|---|---|---|---|---|
| Variable | Control | TRM | Control | TRM | Treatment | Parity | Treatment x parity | ||||||||
| Insemination estrus, % | in | 0.0 | 55.8 | 0.0 | 42.9 | <0.01 | 0.02 | - | |||||||
| Pregnancy d, % | 32 | 40.5 (279) | 29.2 (260) | 44.5 (470) | 50.3 (471) | 0.22 | <0.01 | <0.01 | |||||||
| Pregnancy d, % | 67 | 37.6 (277) | 27.4 (259) | 41.0 (463) | 44.7 (468) | 0.15 | <0.01 | <0.01 | |||||||