By Caio Figueiredo, Veterinary Medicine Extension
Emissions of greenhouse gases (GHG) such as methane have clearly become a major topic of discussion. In 2022, a total of 6,343 million metric tons (MMT) of GHG were emitted in the U.S. (EPA, 2024; Table 1), and 10% of the total emitted GHG was attributed to the agriculture sector (EPA, 2024; Figure 1A). Of the total GHG emissions attributed to the agriculture sector (618.5 MMT CO2 Eq.), 56% were attributed to enteric fermentation, livestock manure, and grazed land (345 MMT CO2 Eq.). Among the GHG emitted by species production systems, beef cattle, dairy cattle, and swine ranked highest in emissions (Figure 1B). Although most beef cattle emissions were from enteric fermentation, a greater proportion of the GHG emitted by dairy cattle and swine were of manure origin. Considering that the greatest portion of livestock GHG emissions are of enteric fermentation origin, we will highlight some of the most recent data regarding nutritional strategies to reduce enteric methane emissions in ruminants.
Among several effective nutritional strategies to reduce methane (CH4) that have been investigated (Table 2), the most effective were those based on inhibitors (≥ -31.8%). Methane inhibitors consist of bromoform (found in seaweed), and 3-nitrooxypropanol (3-NOP). Interest in the use of macroalgae (Asparagopsis taxiformis – seaweed) for the reduction of CH4 emissions increased after promising data from sheep were published. Since then, multiple macroalgae have been investigated, but only Asparagopsis taxiformis appears to have the capacity to mitigate CH4. Based on recent data, CH4 yield decreases by 1.5 to 2.0 g/kg of dry matter intake for every 100 mg/d increase in bromoform intake (Figure 2A and 2B; Hristov et al., 2022). Despite the promising results, there are many challenges associated with this strategy such as decreased dry matter intake, environmental impacts of bromoform, and effects on animal health and milk quality. Furthermore, bromoforms are volatile with activity decreasing over prolonged storage or upon exposed to sunlight or heat (Hristov et al., 2022).
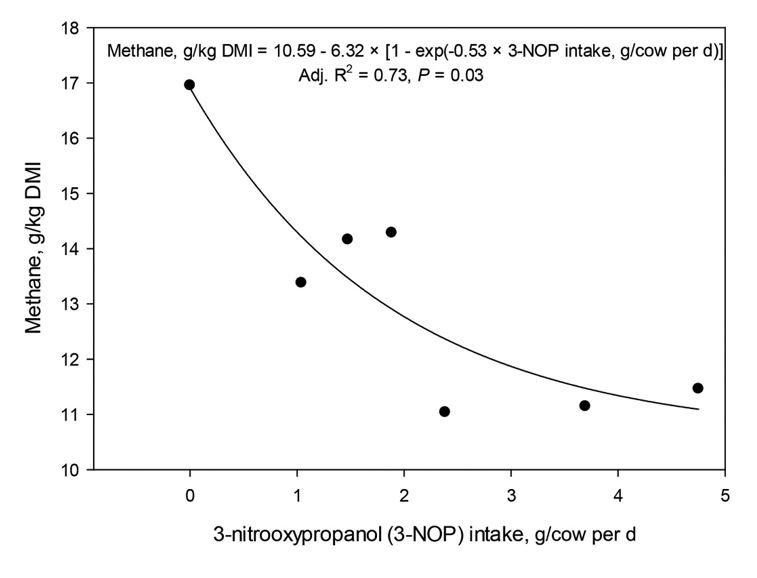
3-NOP is a compound that reduces enteric methane formation by inhibiting methyl-coenzyme M reductase (Pitta et al., 2022), and has been associated with reduced prevalence of methanogen organisms (Methanobrevibacter and Methanosphaera) in the rumen of dairy cows (Pitta et al., 2021). Consistently, 3-NOP decreased CH4 yield by 28 to 32% compared with controls (dose dependent, Figure 3), with no observed detrimental effects on dry matter intake, milk production, or body weight change (Hristov et al., 2022). In addition, a recent study showed that 3-NOP can be fed to cows for long periods of time (e.g., 1 year) without detrimental effects on milk production, milk components, or feed efficiency (van Gastelen et al., 2024). Overall, research related to feed additive strategies to mitigate CH4 emissions in ruminants has shown promising and exciting results that may change major components of ruminant production.
Table 1. Recent Trends in U.S. Greenhouse Gas Emissions and Sinks (MMT CO2 Eq.; adapted from US-EPA, 2024 PDF file)| Gas/Source | % change since 1990 | |||||||
|---|---|---|---|---|---|---|---|---|
| 1990 | 2005 | 2018 | 2019 | 2020 | 2021 | 2022 | ||
| CO2 | 5,131.6 | 6,126.9 | 5,362.2 | 5,234.5 | 4,689.0 | 5,017.2 | 5,053.0 | -1.5% |
| CH4 excludes LULUCF sourcesa | 871.7 | 795.4 | 771.5 | 754.3 | 735.3 | 720.5 | 702.4 | -19.4% |
| N2O excludes LULUCF sourcesa | 408.2 | 419.2 | 439.5 | 416.4 | 391.2 | 398.2 | 389.7 | -4.5% |
| HFCs | 47.7 | 121.7 | 163.9 | 168.2 | 170.3 | 177.0 | 182.8 | 282.9% |
| PFCs | 39.5 | 10.2 | 7.4 | 7.3 | 6.6 | 6.3 | 6.7 | -83.1% |
| SF6> | 37.9 | 20.2 | 7.6 | 8.4 | 8.1 | 8.5 | 7.6 | -80.0% |
| NF3 | 0.3 | 1.0 | 0.7 | 1.1 | 1.3 | 1.1 | 1.1 | 238.3% |
| Total Gross Emissions (Sources)a | 6,536.9 | 7,494.6 | 6,752.7 | 6,590.1 | 6,001.8 | 6,328.8 | 6,343.2 | -3.0% |
| Mitigation strategy | Mean effect, %1 | 95% CI | P-value |
|---|---|---|---|
| Daily CH4, g/d | |||
| Inhibitors | −35.2 | (−40.4; −29.5) | <0.001 |
| Electron sinks | −17.1 | (−20.1; −14.0) | <0.001 |
| Oils and fats | −19.5 | (−23.6; −15.2) | <0.001 |
| Tanniferous forages | −11.6 | (−16.1; −6.8) | <0.001 |
| CH4 yield, g/kg of DMI | |||
| Inhibitors | −33.6 | (−39.9; −26.6) | <0.001 |
| Electron sinks | −15.4 | (−18.1; −12.6) | <0.001 |
| Oils and fats | −14.8 | (−18.0; −11.4) | <0.001 |
| Tanniferous forages | −10.0 | (−14.0; −5.9) | <0.001 |
| CH4 intensity, g/kg of milk yield (dairy animals) | |||
| Inhibitors | −31.8 | (−40.0; −22.4) | <0.001 |
| Electron sinks | −12.7 | (−16.3; −9.0) | <0.001 |
| Oils and fats | −11.9 | (−17.6; −5.7) | 0.001 |
| Tanniferous forages | −17.8 | (−26.4; −8.1) | 0.003 |
| 1Mean effect relative to control; CI: Confidence Interval | |||
Figure 1. A) Total U.S. Greenhouse Gas Emissions by Economic Sector; B) Greenhouse Gas Emissions from Livestock in 2018 (CH4 is methane; N2O is nitrous oxide. MMT CO2 eq. is million metric tons of carbon dioxide equivalent (Adapted from US-EPA, 2024).
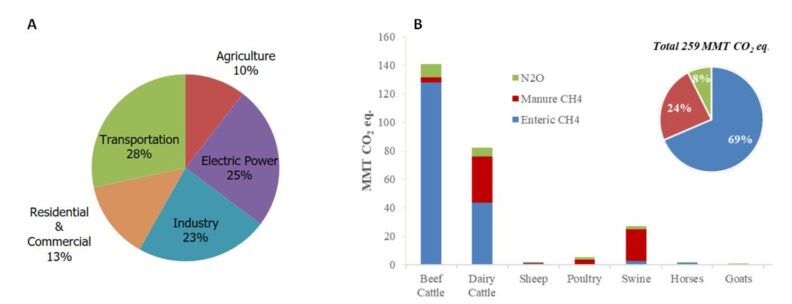
Figure 2. A) Relationship of bromoform intake on enteric methane emission yield in dairy cows; B) Dose titration effect of seaweed X on methane and hydrogen emissions in vitro (Adapted from Hristov et al., 2022).
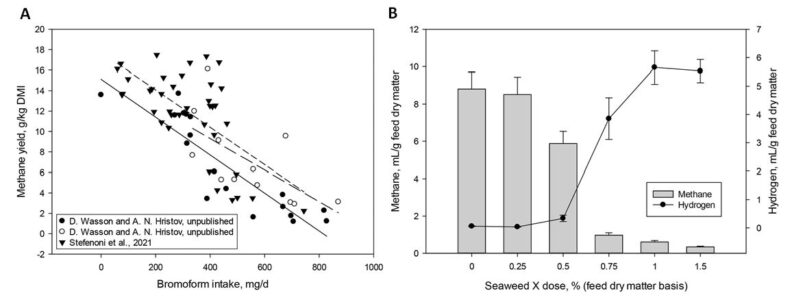
Figure 3. Relationship of 3-nitrooxypropanol (3-NOP) intake and enteric methane emission yield (g/kg of DMI) in dairy cows. Adj. R2 = adjusted R2. (Adapted from Hristov et al., 2022).